
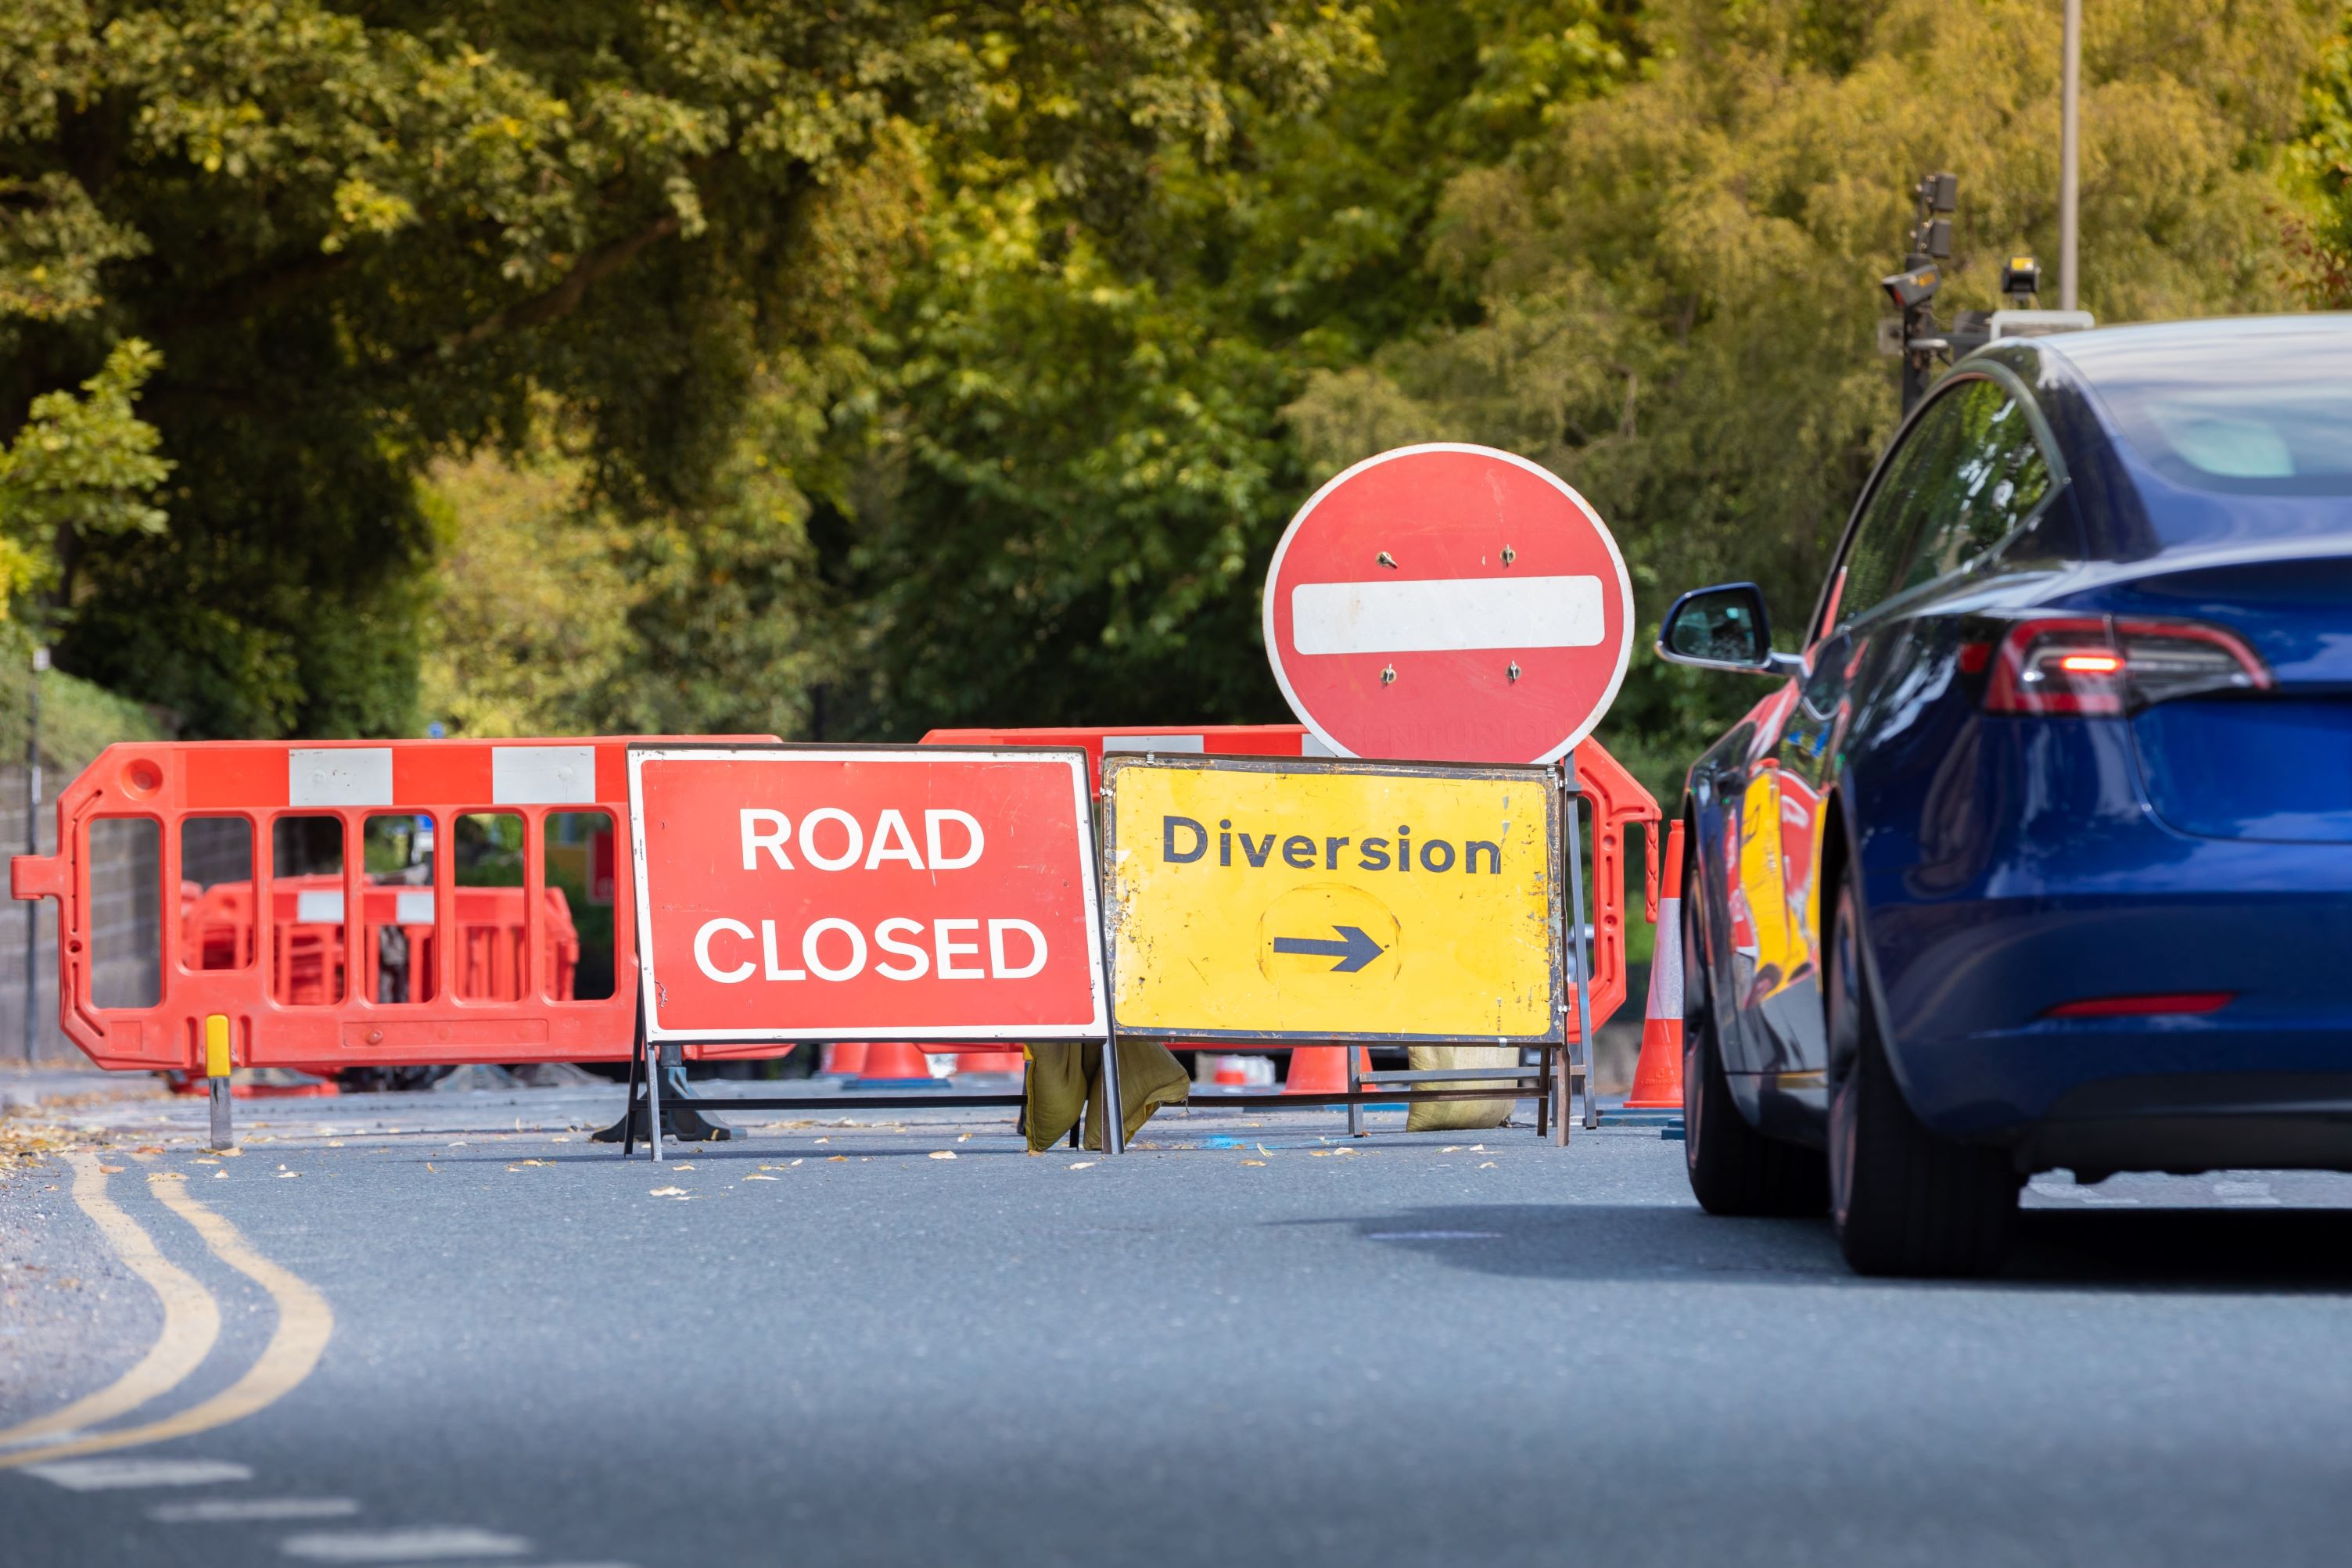
The British road quality index
Driving in the UK comes with its challenges, and one issue most drivers will recognise is the quality and safety of our roads. Many stretches have been deteriorating for years, which is why the Government announced a £7.3 billion investment in local roads over the next four years in November’s budget. This funding aims to make our roads safer for everyone, but it will take time before we see the full benefits.
To understand the current state of our roads, we analysed data from 18 of the largest local authorities across the UK. We looked at the total number of enquiries made to councils about potholes and other road defects (via Freedom of Information requests), how effective each council is at maintaining its roads (via the Department for Transport), the number of claims made against councils for damage to vehicles caused by poor road conditions (via Freedom of Information), and the total number of road casualties (via ONS data). Each metric has been individually weighted and then normalised and finally, totalled to create the road quality score.
The findings
Rank | Local Authority | Total number of enquiries made regarding potholes or other road defects | Enquiries per 100,000 people | Road maintenance effectiveness | Number of claims | Claims per 100,000 people | Number of road casualties | Casualties per 100,000 people | Road quality score |
|---|---|---|---|---|---|---|---|---|---|
1 | Leeds City Council | 15,710 | 1,858 | Green | 292 | 35 | 1,463 | 173 | 78.25 |
2 | Essex County Council | 17,812 | 923 | Green | 5,946 | 308 | 2,313 | 120 | 72.02 |
3 | North Yorkshire Council | 4,272 | 672 | Amber | 154 | 24 | 1,043 | 164 | 71.43 |
4 | Sheffield City Council | 8,880 | 1,524 | Amber | 158 | 27 | 766 | 132 | 71.19 |
5 | Liverpool City Council | 3,601 | 708 | Amber | 162 | 32 | 841 | 165 | 70.59 |
6 | Bristol City Council | 3,556 | 719 | Amber | 122 | 25 | 841 | 170 | 70.34 |
7 | Buckinghamshire Council | 8,970 | 1,550 | Amber | 618 | 107 | 607 | 105 | 69.33 |
8 | Bradford Council | 3,631 | 644 | Amber | 112 | 20 | 1,030 | 183 | 69.33 |
9 | Kent County Council | 10,484 | 651 | Amber | 922 | 57 | 2,898 | 180 | 67.15 |
10 | Croydon Council | 1,846 | 451 | Amber | 48 | 12 | 933 | 228 | 64.71 |
11 | Devon County Council | 40,169 | 3,390 | Amber | 647 | 55 | 1,289 | 109 | 62.53 |
12 | Durham County Council | 28,952 | 5,381 | Amber | 66 | 12 | 452 | 84 | 58.20 |
13 | Somerset Council | 15,294 | 2,600 | Amber | 636 | 108 | 864 | 147 | 57.90 |
14 | Leicester City Council | 1,347 | 347 | Red | 47 | 12 | 752 | 194 | 54.94 |
15 | Suffolk County Council | 10,950 | 1,439 | Red | 197 | 26 | 1,141 | 150 | 54.19 |
16 | Newcastle City Council | 16,690 | 5,206 | Amber | 99 | 31 | 434 | 135 | 50.83 |
17 | Cornwall Council | 34,937 | 5,990 | Amber | 417 | 71 | 941 | 161 | 40.37 |
18 | Nottingham City Council | 18,646 | 5,632 | Amber | 544 | 164 | 761 | 230 | 6.61 |
You might notice we haven’t included Birmingham City Council or Manchester City Council within our ranking, and both are large local authorities. Both councils responded to our Freedom of Information requests; however, they couldn’t provide all data we asked for, so we could not fairly compare against the other areas. For transparency, we have included the unranked data below for each council:
Local Authority | Total number of enquiries made regarding potholes or other road defects | How effective is the local authority in maintaining local roads | Number of claims made against the local authority | Number of road casualties |
|---|---|---|---|---|
Birmingham City Council | 12,193 | Amber | N/A | 2,296 |
Manchester City Council | N/A | Green | 69 | 720 |
The best performing local authority
Our research suggests that Leeds City Council is the best-performing local authority for road quality, reflecting the Department for Transport’s recent traffic-light system, which has awarded Leeds the ‘green’ rating, the highest category. This green category is awarded to local authorities with strong performance in road conditions and investment in repairs, and to those that focus on long-term preventive maintenance rather than short-term measures. The only other council in our ranking to be awarded green is Essex County Council, which ranks second in our index.While the number of enquiries made regarding potholes and other road defects for Leeds sits at 15,710 – one of the highest numbers reported, a relatively low number of claims have been made against the local authority for damage to vehicles from roads (292). In 2024, the ONS reported 1,463 road casualties on Leeds roads, which works out at 173 per 100,000 people. To bring this number down, Leeds City Council has released its ‘Leeds vision zero 2024 strategy’, which aims to have no one killed or seriously injured on the roads in Leeds by 2040.
The local authority with the most work to do
According to our index, Nottingham City Council has the most work to do to improve the quality of its roads.
In 2025, 18,646 enquiries were made regarding potholes and other road defects, and 544 claims were made against the council for vehicle damage caused by poor roads. This works out to 164 claims per 100,000 residents. What’s more, according to the ONS, 761 road casualties took place on Nottingham’s roads in the year 2024.
A recent study carried out by Slater Gordon Lawyers shows that half of people in Nottingham do not feel safe on the city’s roads, with 59% flagging that the roads have become more dangerous over the past year. Speaking to Nottingham World, Matthew Tomlinson, Head of Serious Injury (North) at Slater and Gordon says:
“It is very concerning that half of people in Nottingham do not feel safe on their roads – a situation many also believe has worsened over the past year. The levels of dangerous driving, in addition to the conditions of the roads, are creating a situation which is threatening the safety of all road users.”
“We all have a responsibility to make the roads as safe as possible, which includes our own behaviours... Ensuring we drive in a safe and appropriate manner, while taking responsibility for the condition of our cars, is vital in the creation of safer roads and in the protection of fellow drivers, cyclists and pedestrians.”
Spencer Davi, UK Sales and Marketing Director shares their thoughts on this index:
“When you drive for a living, the quality and safety of the road can affect everything from your personal safety, how stressed you feel while at work, to the lifespan of your vehicle. A road’s quality can shape everything from productivity to wellbeing.
Our research highlights both the local authorities performing well and those where improvement is needed. We appreciate the significant pressures councils are facing, however investment in our roads is essential if we want to ensure safer and quality journeys for everyone.
As road users, I urge everyone to drive safely and if there is something you can do to improve the quality of your local road, for example, report a nuisance pothole for repair, then it’s well worth taking the time out to do so. Collectively, everyone’s actions can make a real difference.”
Methodology
This index ranks local authorities based on road condition and safety, using a combination of Freedom of Information responses and official government data.Four measures were included:
The number of pothole or road defect enquiries per 100,000 residents (2025, via FOI)
The Department for Transport’s local road maintenance rating (Green/Amber/Red)
The number of vehicle damage claims made against the council per 100,000 residents (2025, via FOI)
Road casualties per 100,000 residents (2024, latest available data)
To ensure fair comparison between areas of different sizes, all volume-based measures were converted into rates per 100,000 residents using the latest available population figures.Each metric was then normalised onto a 0–100 scale, where 100 represents the strongest relative performance and 0 the weakest among the councils analysed. For the maintenance rating, Green was scored highest, Amber mid-ranking and Red lowest before being scaled.The final road safety score was calculated using weighted averages:
Pothole enquiries per 100,000 residents – 30%
Road maintenance rating – 30%
Road casualties per 100,000 residents – 20%
Vehicle damage claims per 100,000 residents – 20%
Scores reflect relative performance within this group of local authorities and are not national rankings. Councils with incomplete datasets were excluded from the final index.
Ready to speak to us?

Headlights Newsletter
The latest news and views from Europe's leading mobility solutions provider.